
Strategy Performance & Analytics
AVAILABLE IN: 
Introduction
The Performance & Analytics tab in the Strategy module allows you to view, analyze, and export the historical and projected performance of a strategy. It is designed to give a visual representation of how your strategy has performed, along with detailed underlying data (like holdings, allocations, incomes, and metrics).
Also, lets you upload backtesting data, define a start date, select instruments and customize widgets to tailor the analytics dashboard.
You can access it either when:
Creating or editing a Strategy, or
Viewing a Strategy on the Marketplace.
Key Terminologies
Term (A–Z) | Definition |
|---|---|
Backtest File | A CSV file containing historical or simulated performance data to test the strategy’s past behavior. |
Base Currency (baseCcy) | The main currency used for performance calculation and reporting. |
Coupon | Interest rate paid on a bond, typically expressed as a percentage of its face value. |
Coupon Date | Date when the next coupon (interest) payment is due. |
Coupon Type | Indicates whether the coupon is fixed or not. |
Early Redemption | Indicates whether an instrument can be redeemed before its maturity date. |
Export Details | Option to download an .xlsx file containing performance data and underlying metrics. |
FX Pair | The currency pair used for foreign exchange conversion. |
FX Rate (fx) | The exchange rate applied for converting values into the base currency. |
FutContSize | Contract size for futures instruments. |
ISIN | International Securities Identification Number — a global identifier for financial instruments. |
Issue Date | The original date when an instrument was issued. |
Last Performance | The final calculated performance value at the end of the reporting period. |
Maturity | The date on which a financial instrument (e.g., bond) reaches its repayment date. |
Moody’s | Credit rating assigned by Moody’s rating agency. |
Nominal | Face or par value of a financial instrument. |
OptContSize | Option contract size, denoting the number of underlying units per option. |
Reallocations | Adjustments made to instrument weights within the strategy over time. |
Value | Indicates performance or Net Asset Value (NAV) of the strategy for a given date. |
Weight | The percentage allocation of a particular instrument within the strategy. |
👉 New to some terms? Check out our full Platform Glossary for more.
Manage Performance & Analytics Tab
Below are the core sections (1–4) of the tab and their usage:
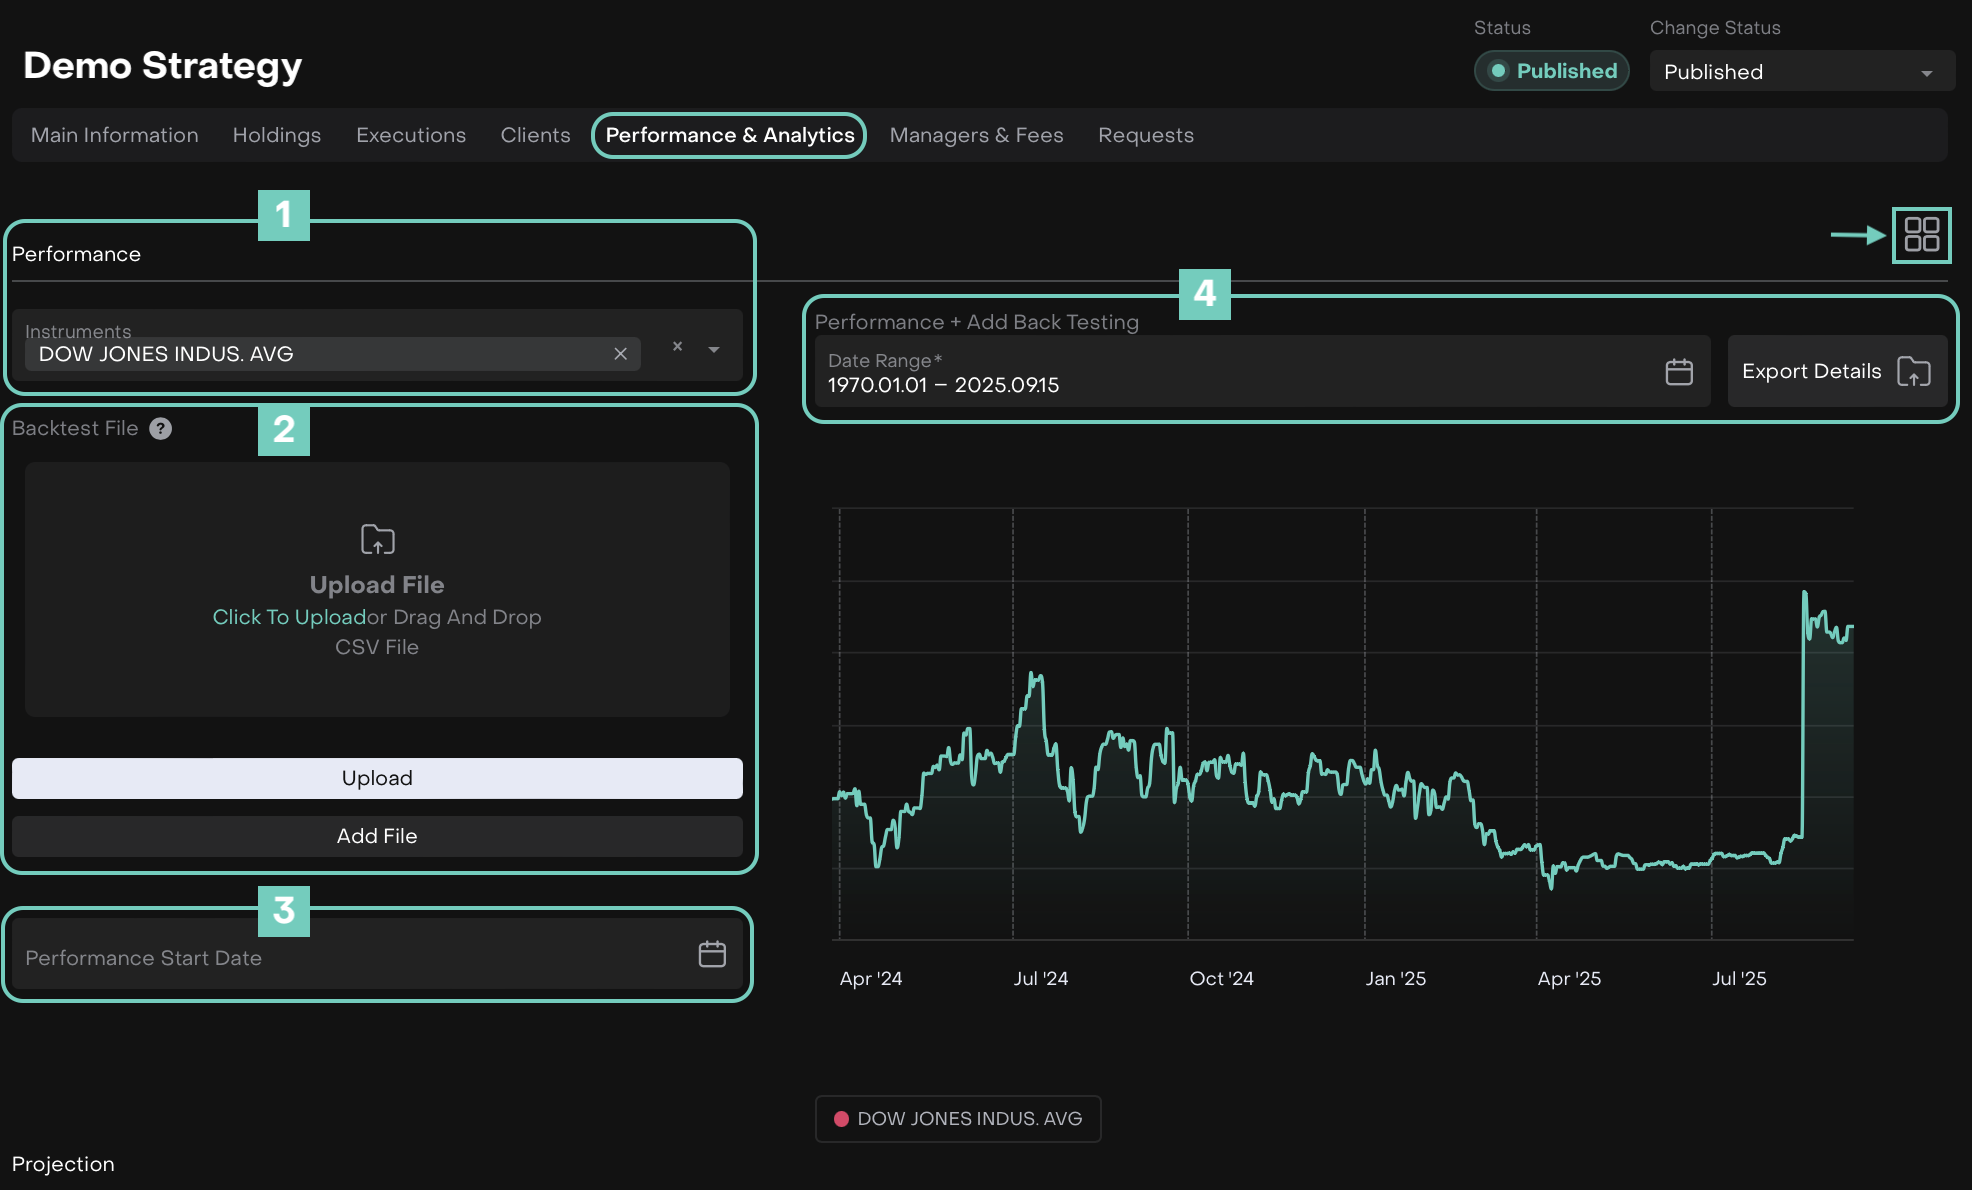
1. Performance
Displays the daily performance of a strategy and allows you to analyze results and compare them with market indexes.
Comparing with Instruments (Indexes)
You can select one or more Instruments (indexes) from the database to compare with their strategy’s performance.
The widget displays two charts:
Performance of the strategy (all holdings)
Performance of the selected index
How to Use:
Toggle On to Edit and in Instruments field, start typing the instrument name (e.g. “APPLE INC”).
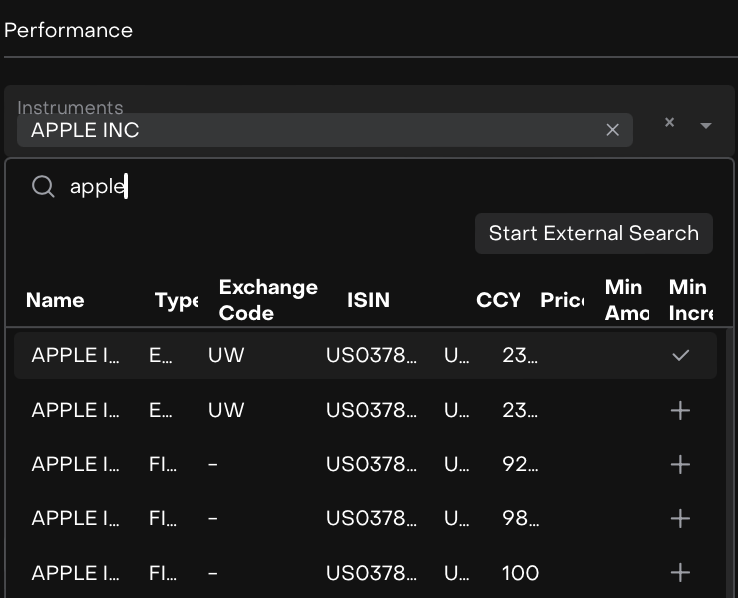
Click + to add an instrument.
Selected instruments will plot on the performance chart.
2. Importing Data (Backtest)
Here, upload historical data via a CSV file with columns: Date and Value.
Column Name | Definition | What to Fill In |
|---|---|---|
Date | The date for each backtested performance entry. | Enter in |
Value | The performance or NAV (Net Asset Value) of the strategy on that date. | Enter the numeric value (e.g. |
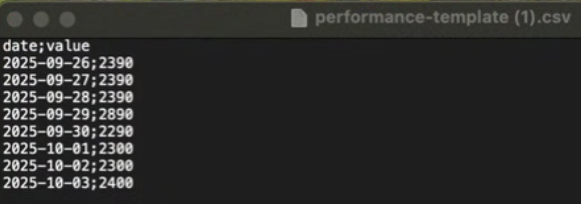
Example of Filled In Template
How to Use:
Download the CSV template via Load Template, fill it in, then Import File or drag and drop to upload. The data will appear in the performance chart.
After successful upload, a confirmation message appears: “Data sent and saved successfully.”
If the file format is incorrect:
Wrong date format → “Something went wrong – Internal server error: null”
Wrong value format → Performance is set to 0 and the same error message appears.
3. Performance Start Date
This field lets you define the starting date for calculating performance metrics.
How to Use:
Click the calendar icon.
Choose the desired start date.
The performance chart and calculations will be recomputed from this date forward.
Use this when you want to reset or align performance calculation from a specific milestone (like after a major rebalance).
4. Automatic Updates (Date Range & Widgets)
The platform automatically recalculates and updates Performance daily based on the holdings in the strategy.
Viewing Performance
The chart shows strategy performance from the creation date.
Each point represents the daily Performance value.
Green indicates a positive return, red indicates a decline.
This section contains:
Date Range(*)
Choose the time period to display on the chart (e.g. 2020.01.01 – 2025.09.15).
Export Details
Download an .xlsx file containing all the detailed data used in performance calculation for the chosen range.
Widgets Manager (
 icon)
icon)
Lets you rearrange, add or remove visualization widgets shown on this tab, allowing you to customize the analytics dashboard.
Always select your desired date range before exporting to ensure the file only includes the intended period.
Exported .xlsx Data Structure
When you click Export Details, you get a file containing multiple sections.Below is the full field reference you can use as a guide.