Client Dashboard
Introduction
When you log in to the Client Portal, the first page you’ll see is the Dashboard. It gives you a comprehensive overview of your portfolios through interactive widgets that you can customize to suit your preferences.
Key Terminologies
Term (A–Z) | Definition |
|---|---|
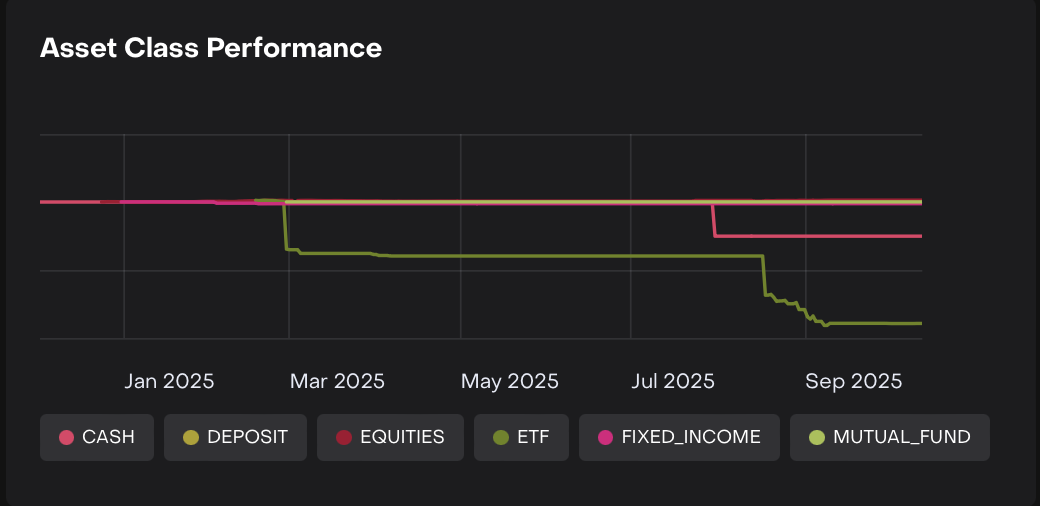
Asset Class Performance | Tracks the performance of various asset classes, helping visualize portfolio growth and risk distribution. |
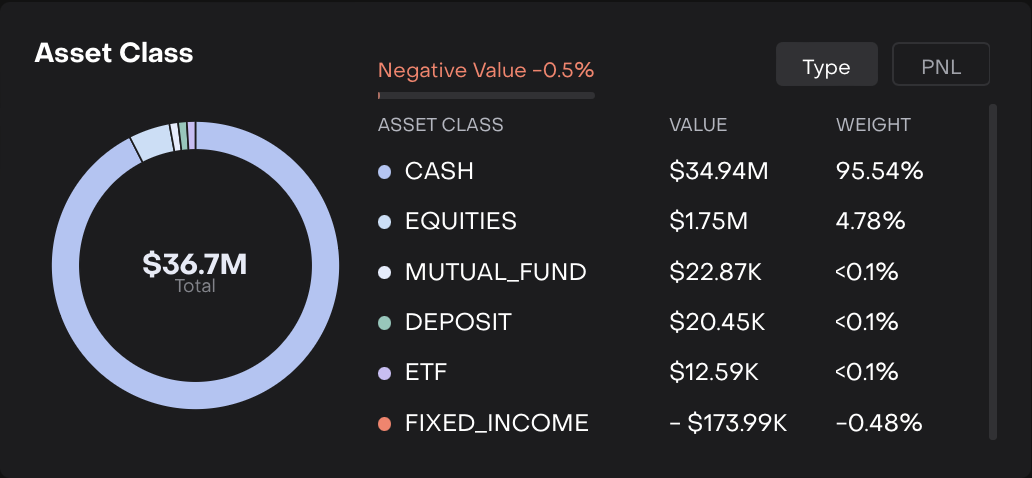
Asset Class Widgets | Breaks down your portfolio by asset class, including value, weight and PNL. |
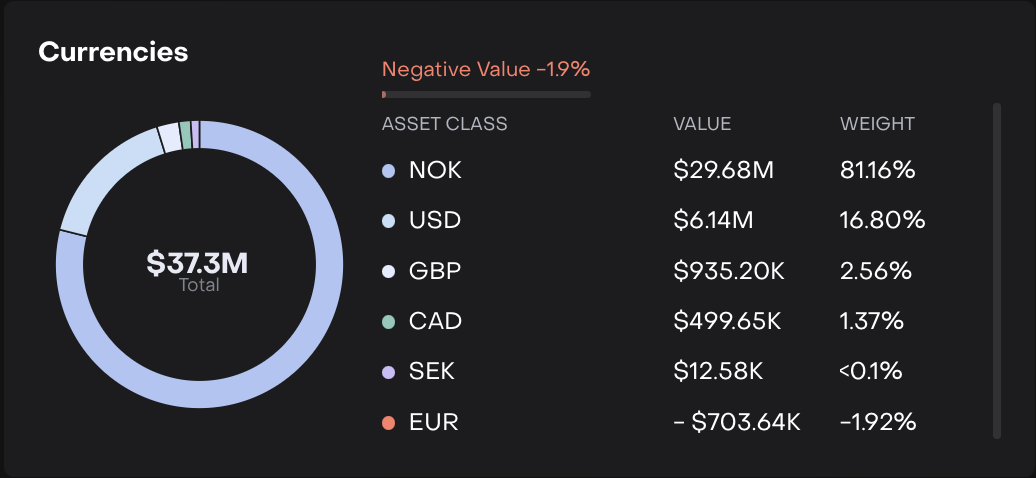
Currencies | Displays portfolio distribution by currency, highlighting value, weight, and any negative performance. |
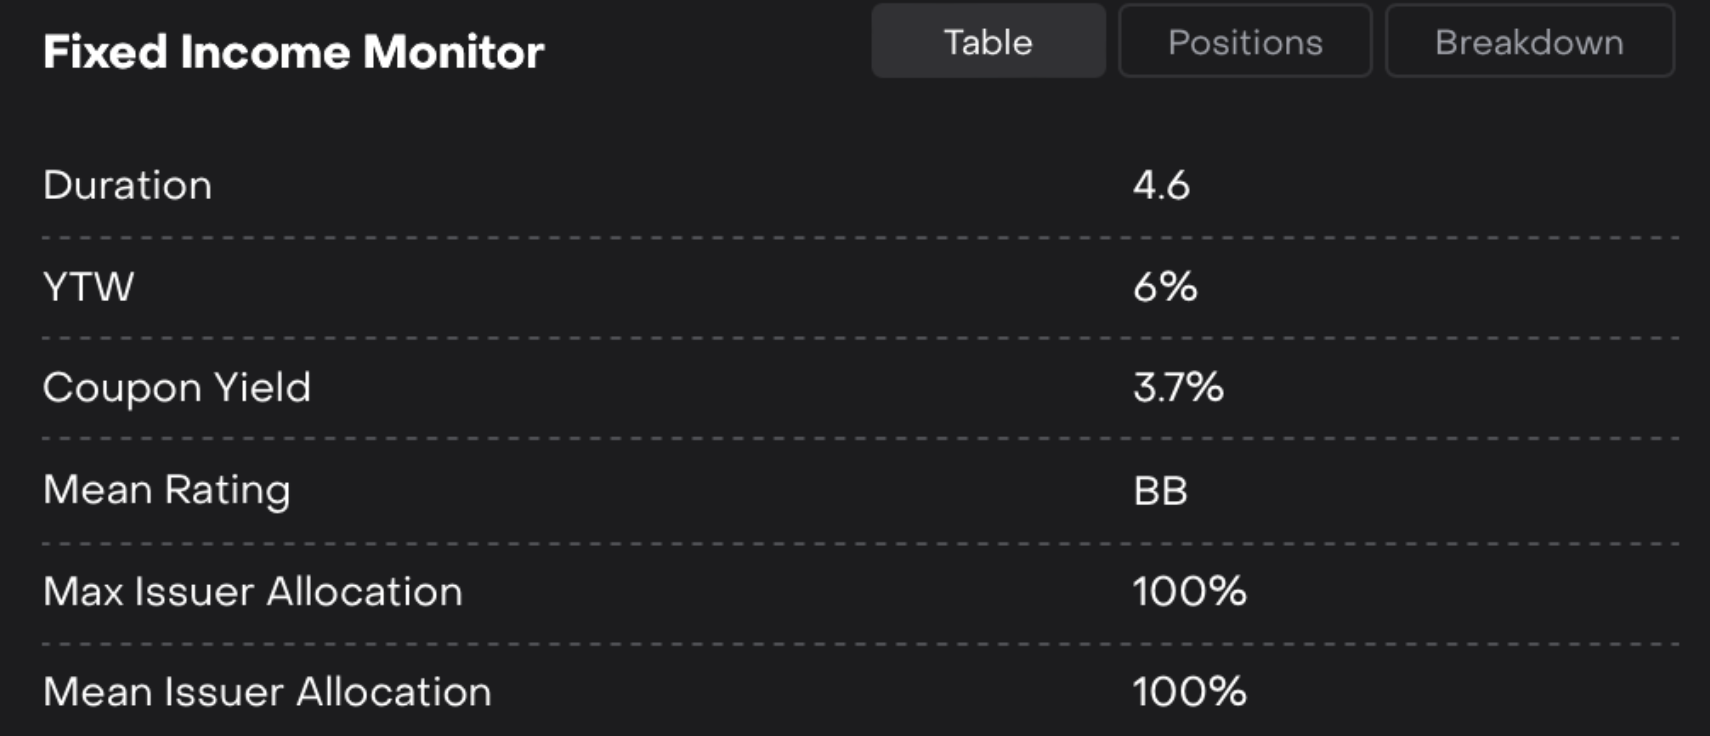
Fixed Income Monitor | Monitors yield, duration, and issuer details of your fixed income holdings. |
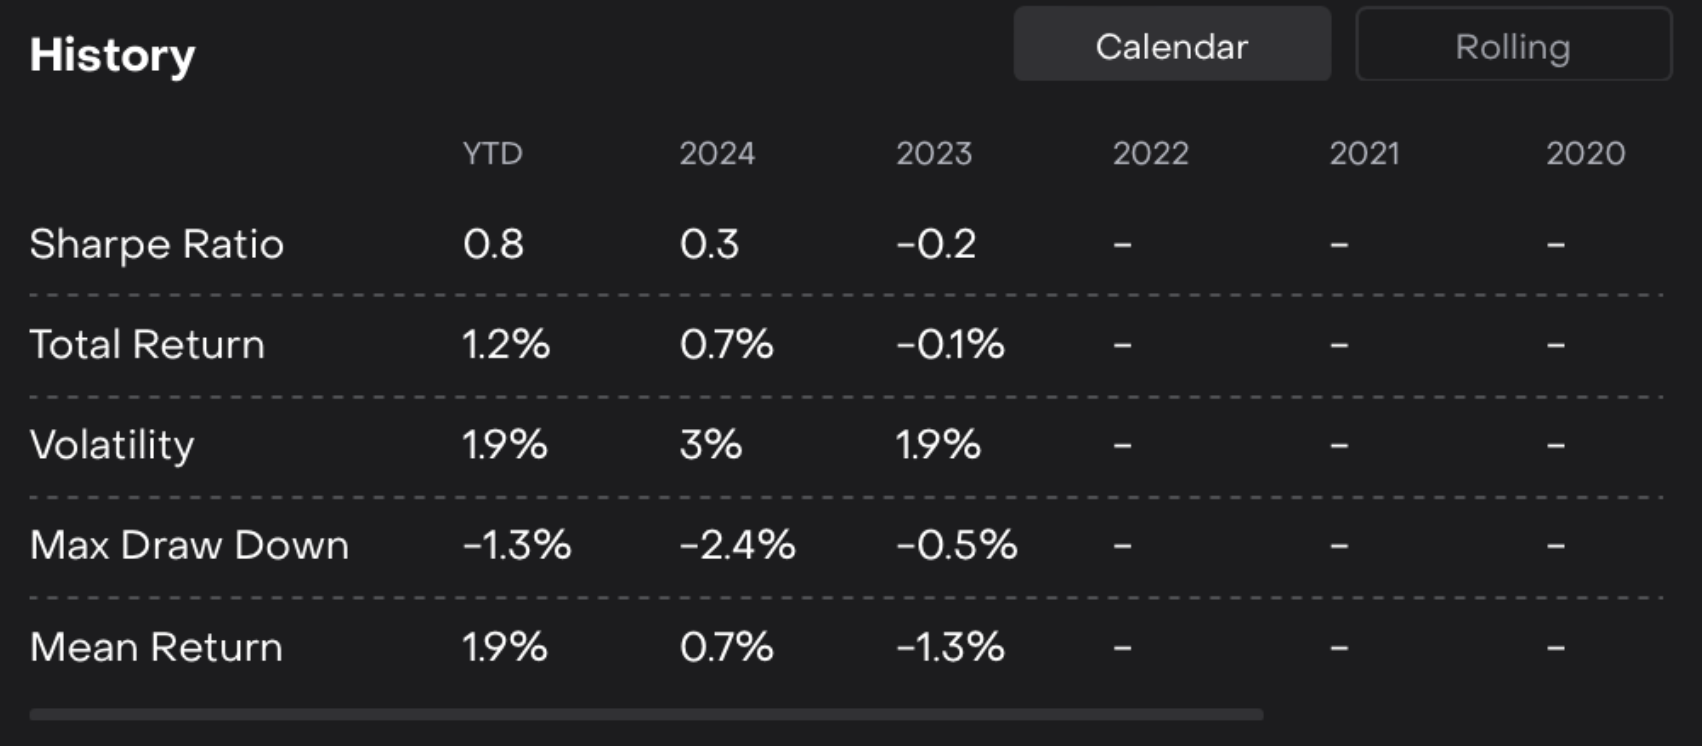
History | Shows performance trends and key metrics for your portfolio over time. |
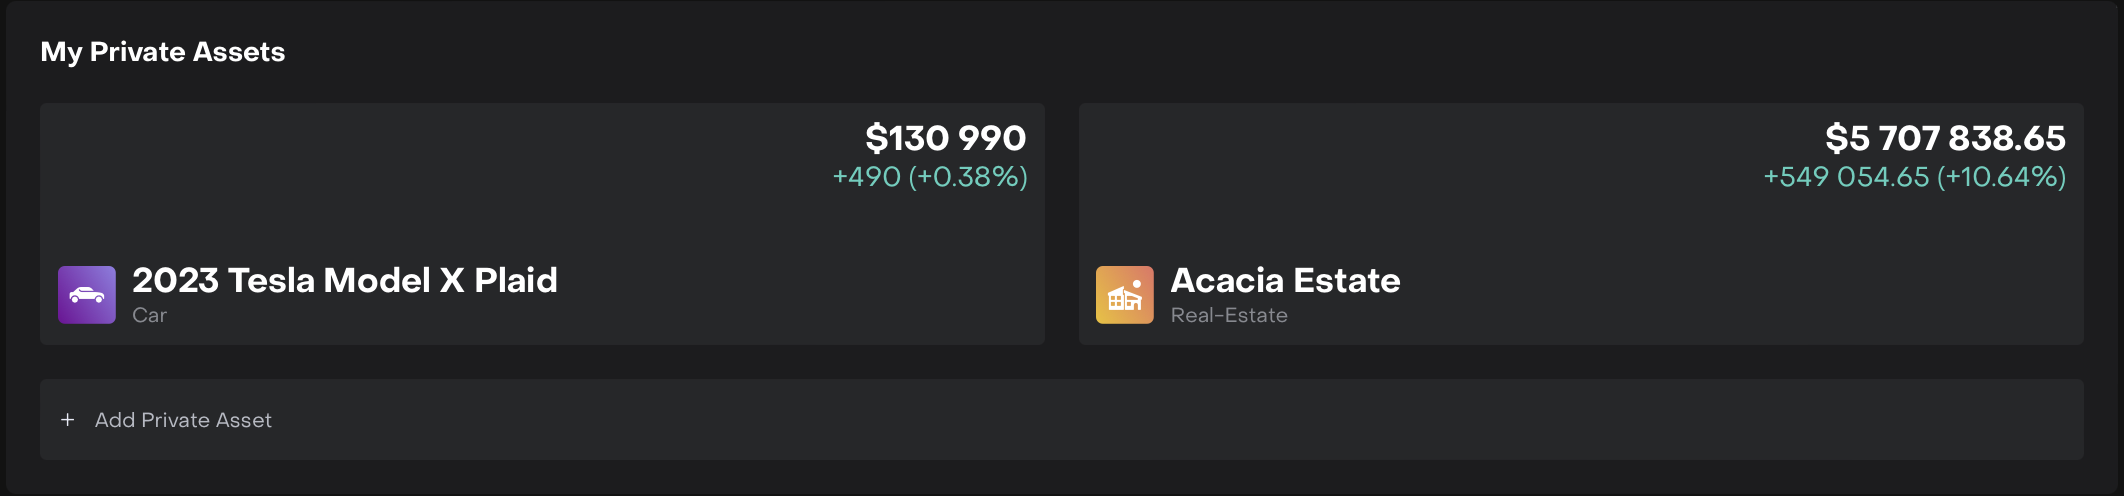
My Private Assets | Lists private or alternative investments in your portfolio with key details. |
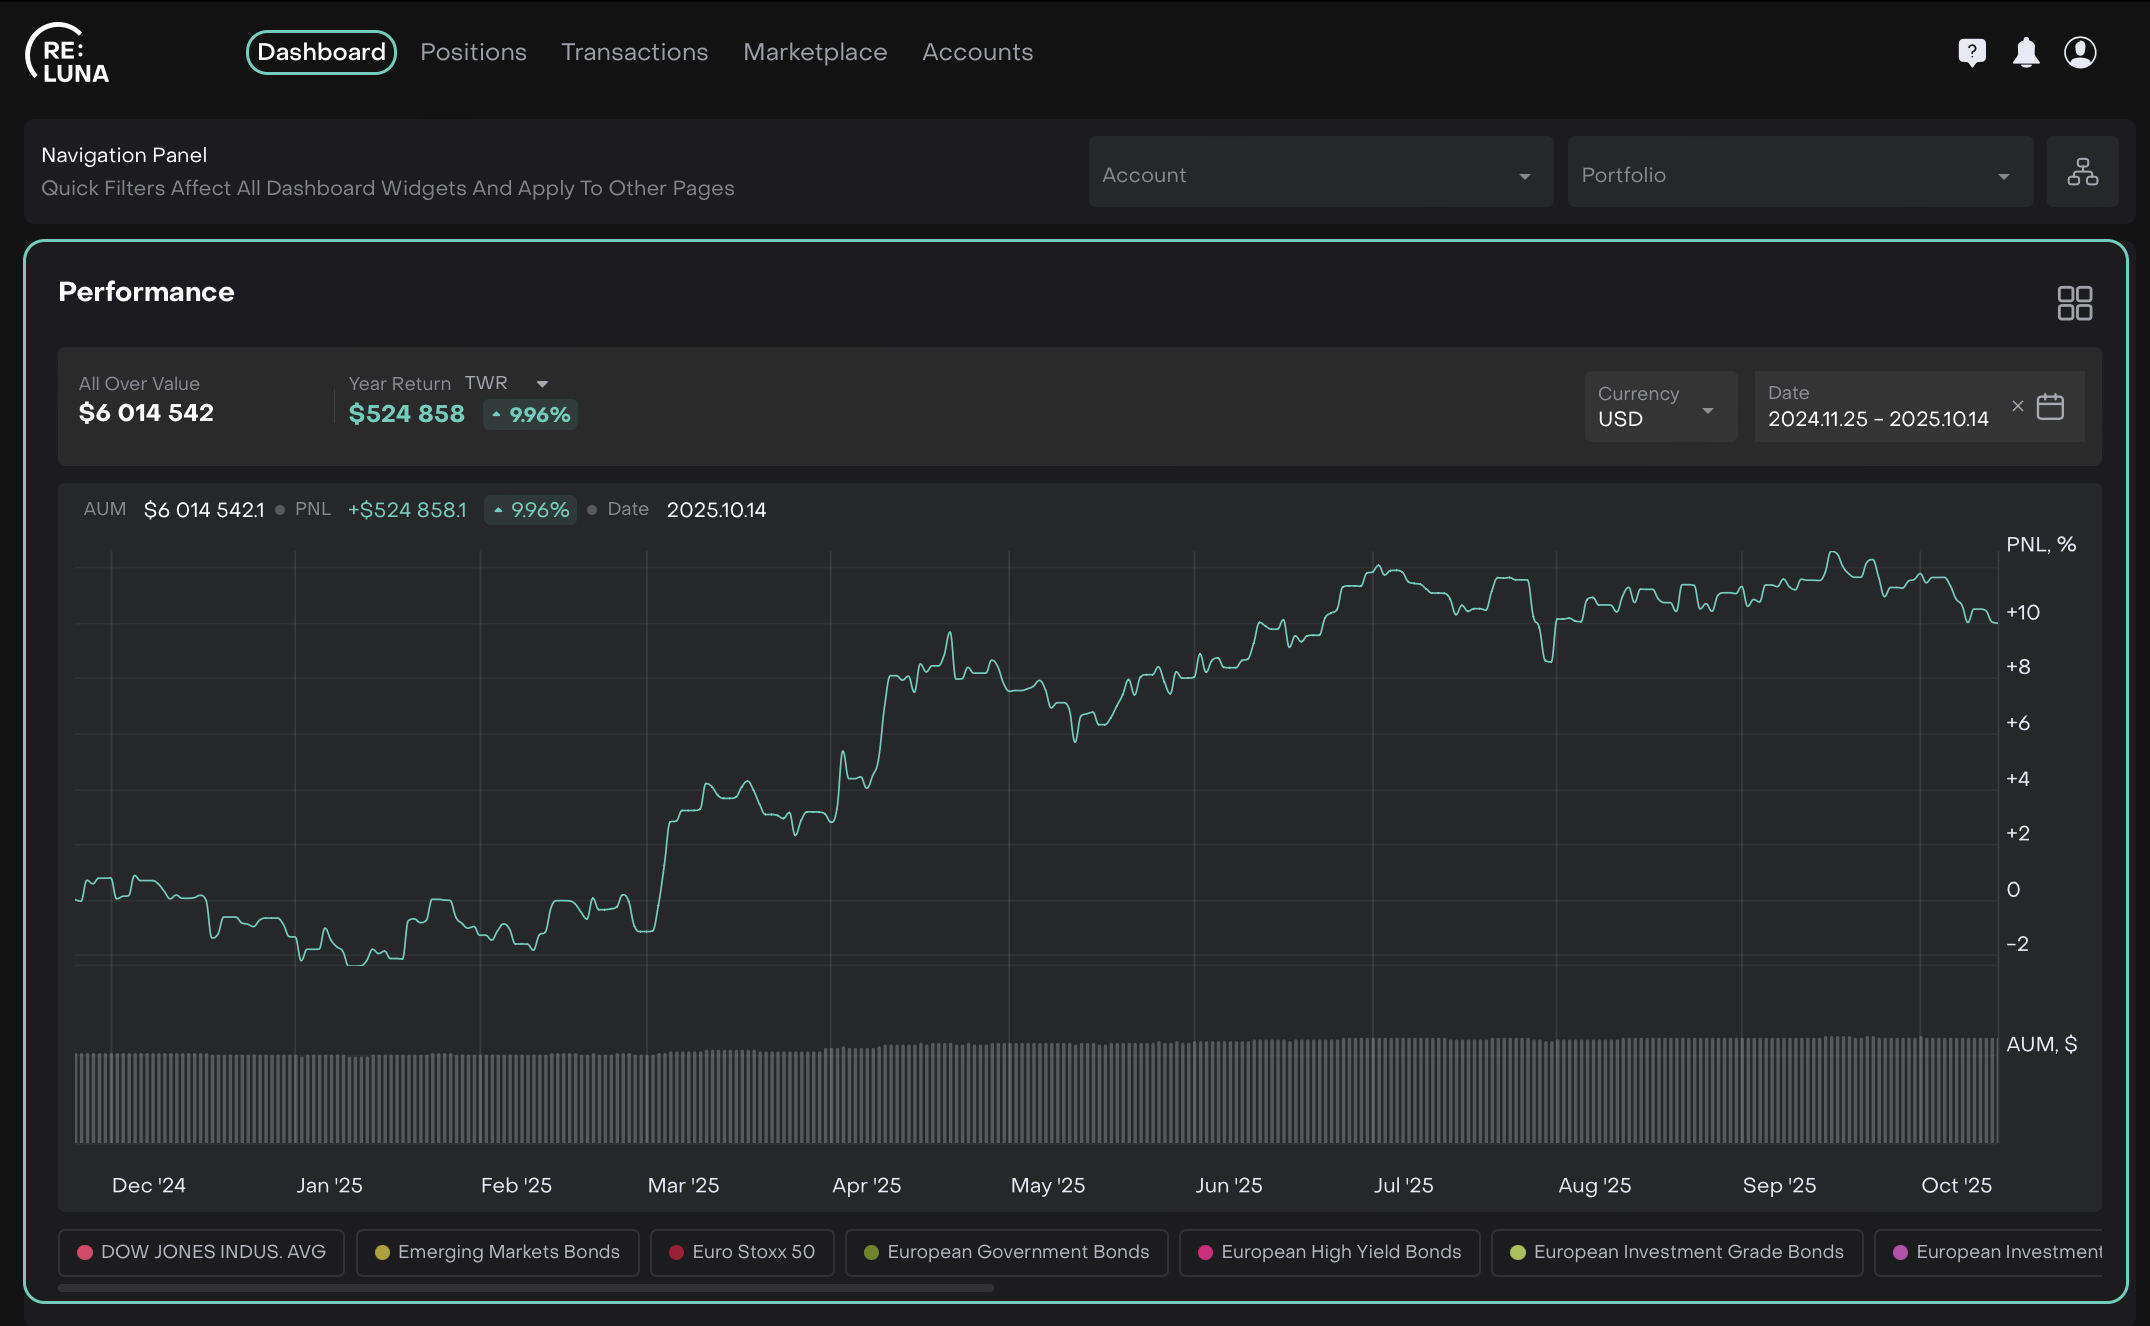
Portfolio Performance Widget | Summarizes your portfolio’s total value and performance for selected parameters. |
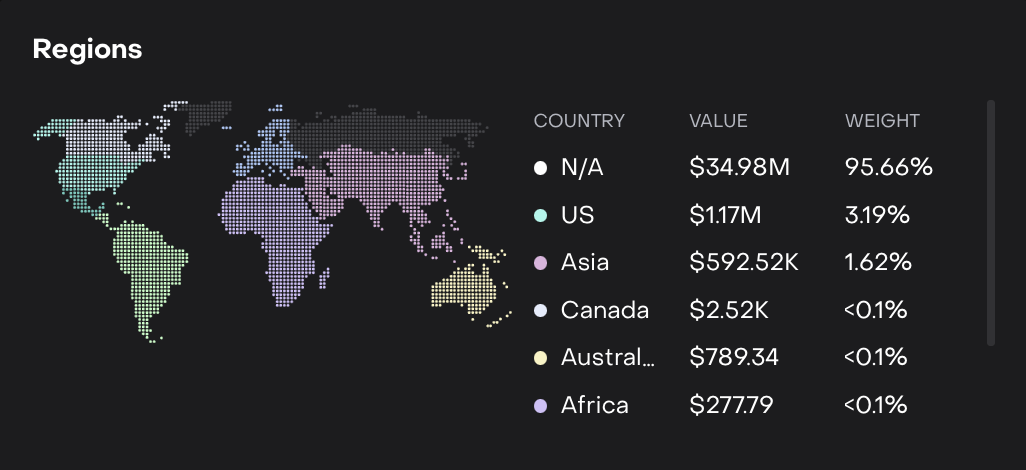
Regions | Displays your portfolio’s geographical exposure with total value and regional weight. |
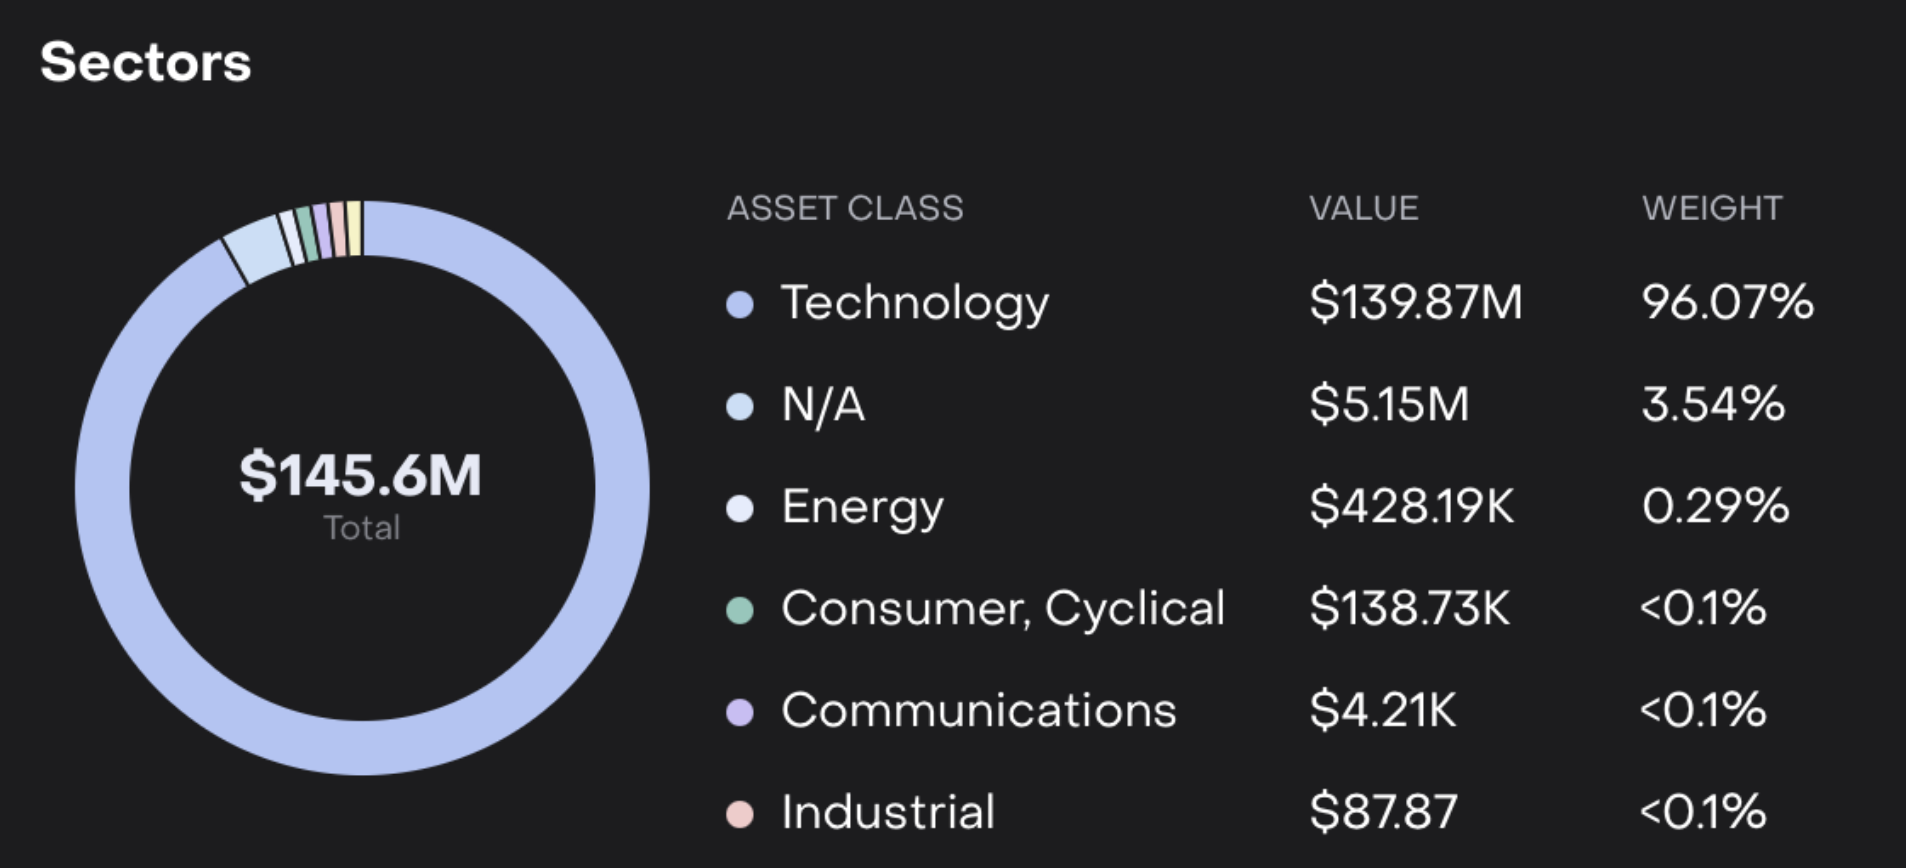
Sectors | Shows portfolio allocation across different industry sectors. |
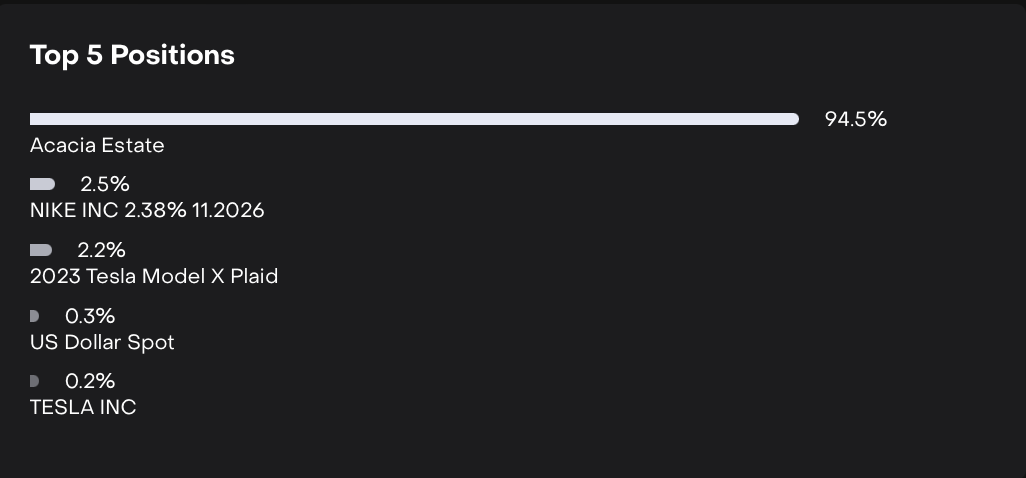
Top 5 Positions | Highlights the five largest positions by value or weight. |
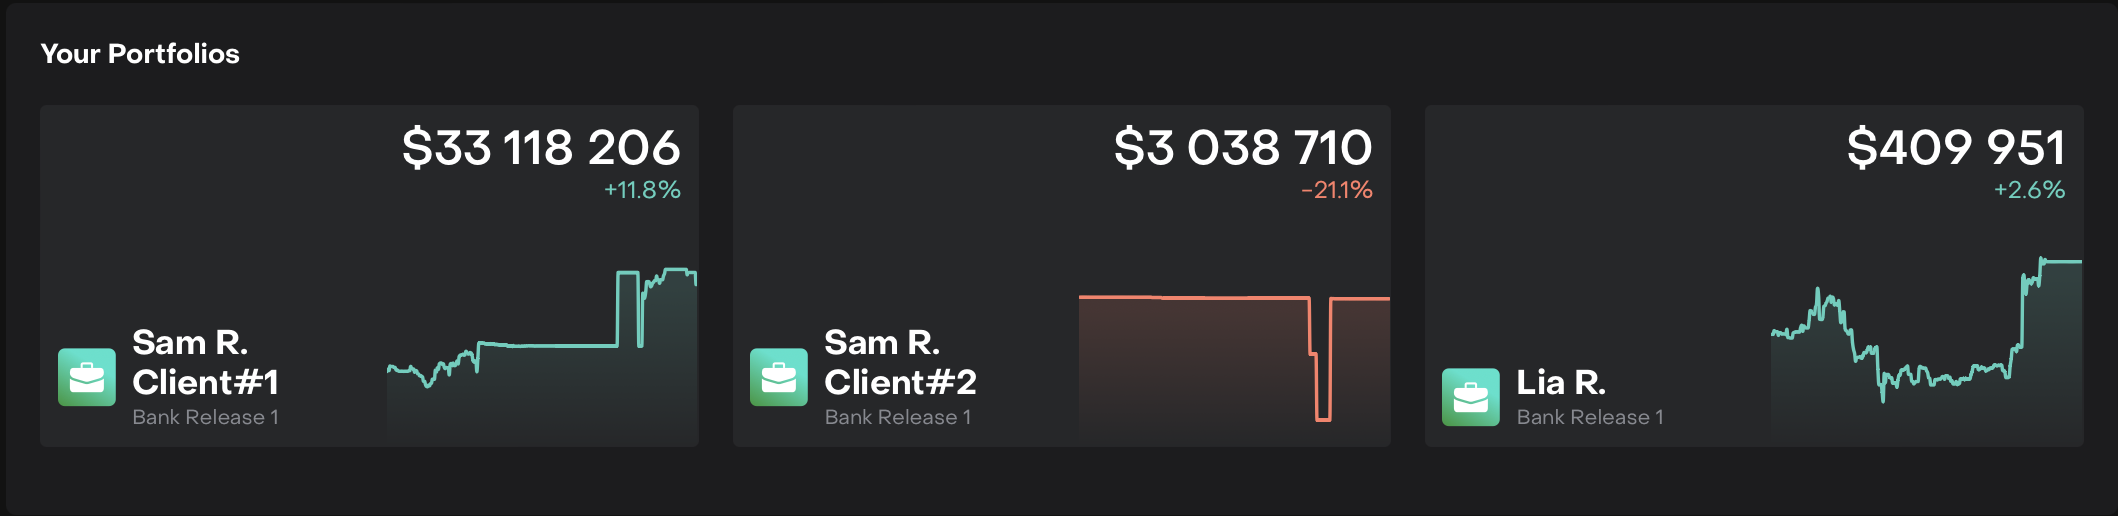
Your Portfolios | Lists all your linked portfolios, showing value and performance. |
👉 New to some terms? Check out our full Platform Glossary for more.
Dashboard Overview
The Dashboard displays key portfolio insights through various widgets that can be enabled or disabled based on your needs.
Manage Widgets – Click on the ![]() icon to enable/disable widgets on your Dashboard.
icon to enable/disable widgets on your Dashboard.
Here’s the list of available widgets on platform:
Shows your portfolio’s value and performance for a selected currency or time period/date.
Displays all portfolios linked to your accounts, along with key details such as portfolio value and performance.
Shows portfolio exposure by geographical regions, including total value and weight of each region.
Shows the portfolio breakdown by currency, including total value, weight and negative performance, if any.
Tracks the performance of different asset types over time. It allows you to visualize portfolio growth, gains or losses by asset types.
Highlights the five largest positions in your portfolio by value or weight.
Detailed breakdown of your portfolio by asset type, including value, weight, and PNL.
Lists private or alternative assets held in the portfolio. Includes asset type, value and performance metrics.
Provides a breakdown of your portfolio by industry sectors, including total value, weight and any negative performance.
Detailed view of portfolio performance over time, including key metrics and rolling calculations.
Displays key metrics and risk details of your fixed income holdings, including yield, duration and issuer allocations.