
Asset Class Performance Widget
AVAILABLE IN: 

Introduction
The Asset Class Performance Widget provides a visual overview of how each asset class in your portfolio has performed over time. It allows you to track trends, identify high-performing or underperforming asset classes, and make informed decisions about portfolio allocation.
How to Use the Widget
Select Asset Classes:
Click on the asset class names to show or hide their performance line on the chart.
Multiple/All asset classes can be selected at the same time.
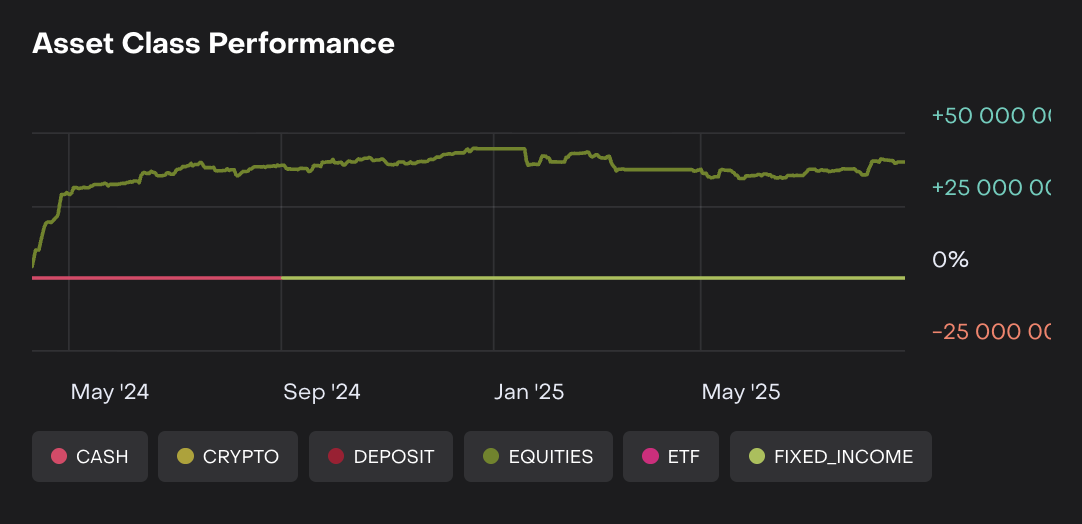
Interpret Performance:
Green values indicate positive returns.
Red values indicate negative returns.
Zero or flat line represents no change in performance.
Time Analysis:
Review trends across months to see which asset classes contributed most to portfolio performance.
Identify periods of strong or weak performance for specific asset classes.
Comparison:
Compare multiple asset classes on the same chart to understand relative performance.
Hover over the lines to see exact performance values at each month.
Usage Scenarios
Evaluate which asset classes are consistently performing well over time.
Detect underperforming asset classes and consider rebalancing.
Use as a visual reference to communicate portfolio performance trends to clients or internal teams.