Skip table of contents

Asset Class Widget

AVAILABLE IN: image-20251027-072316.png image-20251027-072231.png

Introduction

The Asset Class Widget gives you an overview of the value and performance of all asset types in your portfolio(s). It helps you understand how your investments are distributed across asset classes and which classes are contributing positively or negatively to your portfolio’s PnL.

You can view this widget in two modes: Type View and PnL View.

How to Use the Widget

Type View

Visualize the total portfolio allocation by asset class.

Displays: Pie chart showing each/total asset class slice.

Detailed Widget Parameters Explained:

Parameters

What It Shows

Asset Class

Name of the asset type. Example: Equities, Fixed Income.

Weight (%)

Percentage of total portfolio value represented by this asset class.

Value ($)

Total value of all positions within this asset class in the selected currency.

Available Asset Class on Platform:

The platform tracks a wide range of asset types:

  • Alternative Assets

  • Cash

  • Certificate

  • Commodities

  • Crypto

  • Deposit

  • Derivative

  • Equities

  • ETF

  • Fixed Income

  • Funds

  • Futures

  • FX

  • Granted Loan

  • Hedge Fund

  • Index

  • Intangible Asset

  • Loan

  • Mutual Fund

  • Options

  • Other

  • Private Equity

  • Repo

  • SP

  • Tangible Asset

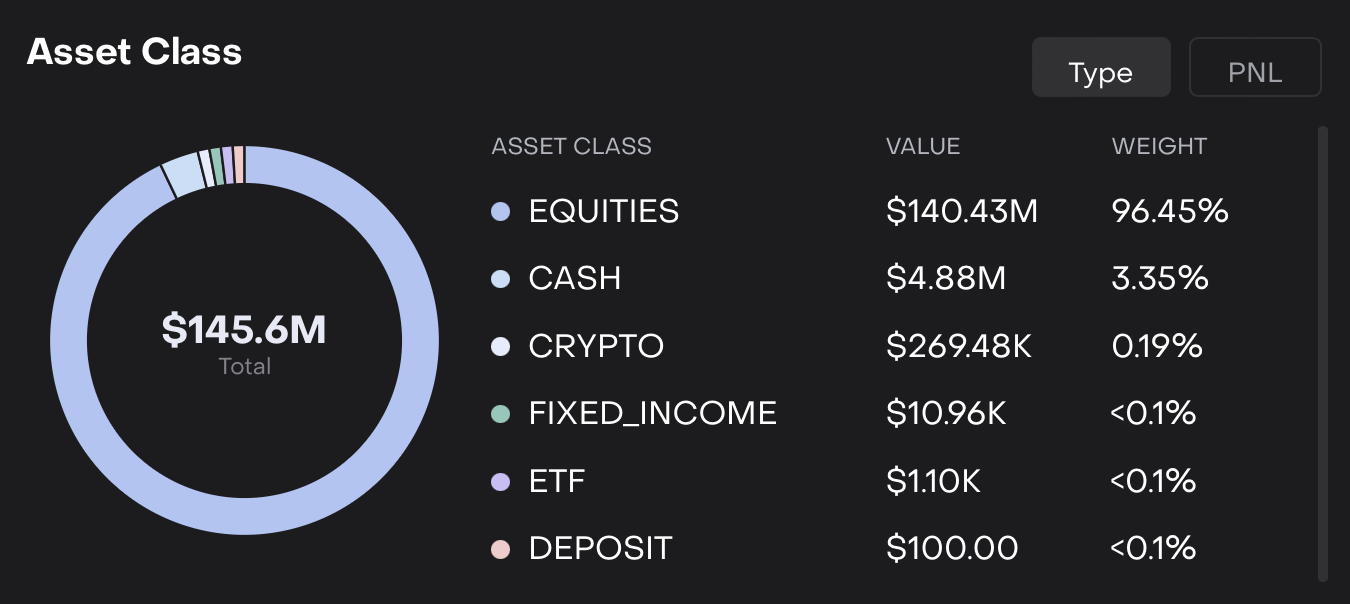
  • The pie chart is interactive. Hover over a slice to see detailed values.

  • Weight and value update automatically based on portfolio transactions and selected date/currency.

PnL View

Track the contribution of each asset class to portfolio profit and loss.

Displays: Horizontal progress bars for each asset class, alongside value and PnL indicators.

Detailed Widget Parameters Explained:

Parameters

What It Shows

Name (Asset Class)

Name of the asset class. Example: Fixed Income, Equities.

Progress Bar

Horizontal bar showing relative size/value of the asset class in the portfolio.

Value ($)

Total value of all positions within the asset class.

PnL ($ or %)

Profit or loss contributed by the asset class. Positive values appear in green, negative values in red.

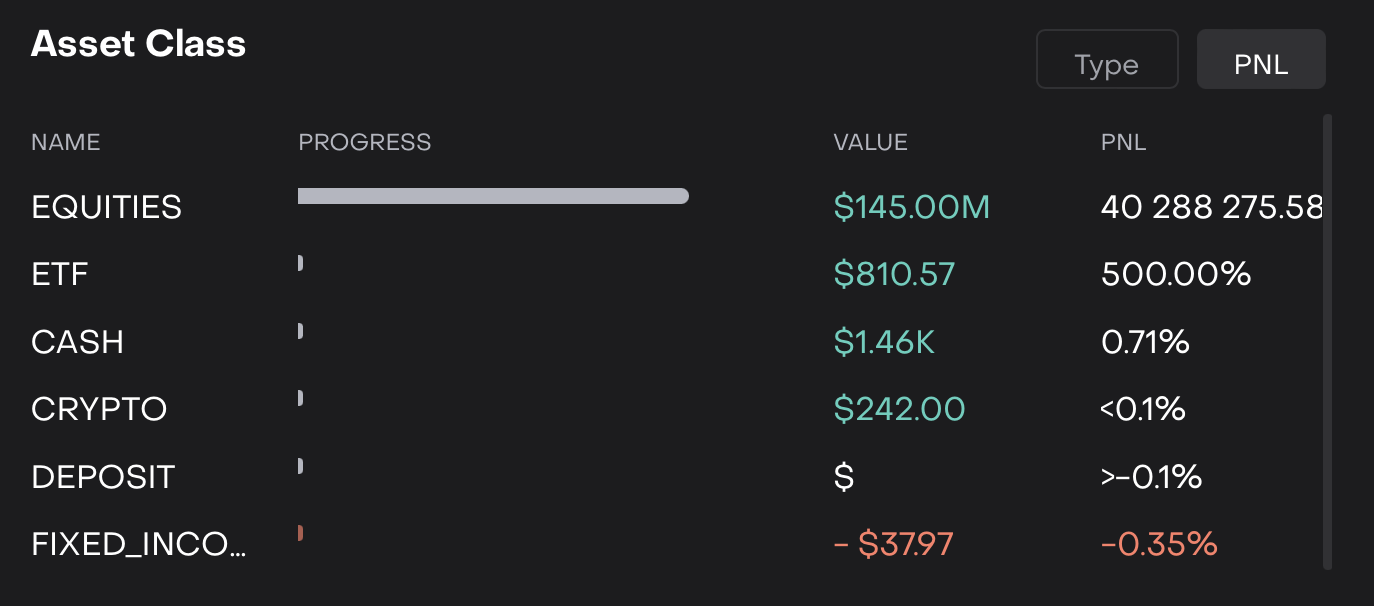
  • Progress bars give a visual sense of allocation versus other asset classes.

  • PnL values reflect realized and unrealized gains/losses depending on the positions in the portfolio.

  • Selecting a different date or currency refreshes all values.

Usage Scenarios

  • Quickly identify which asset classes are the largest in your portfolio (Type View).

  • Monitor which asset classes are performing well or poorly (PnL View).

JavaScript errors detected

Please note, these errors can depend on your browser setup.

If this problem persists, please contact our support.