Skip table of contents

Correlation Widget

AVAILABLE IN: image-20251027-072316.png image-20251027-072231.png

Introduction

The Correlation widget allows you to analyze how closely your portfolio’s returns move in relation to major market benchmarks. It provides a statistical measure (expressed as a percentage) of the strength and direction of the relationship between your portfolio performance and selected indices.

How to Use the Widget

  • On the widget, you can select benchmarks from a dropdown menu.

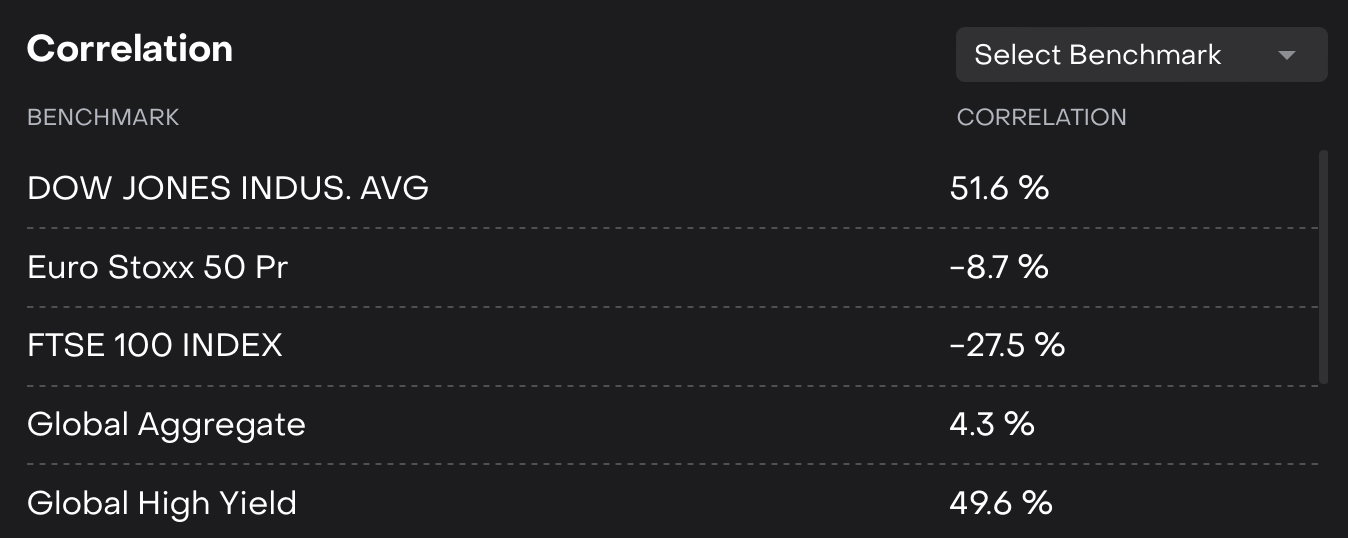
  • The platform calculates and displays the correlation % between your portfolio returns and the chosen benchmark over the selected period.

  • Correlation values update automatically based on date, currency and bank account filters applied on the platform.

What it Shows

  • Displays correlation percentages (%) between your portfolio returns and selected benchmarks.

  • Indicates the strength and direction of the statistical relationship:

    • Positive values → Portfolio tends to move in the same direction as the benchmark.

    • Negative values → Portfolio tends to move in the opposite direction of the benchmark.

    • Values close to 0% → Weak or no meaningful relationship.

Available Benchmarks:

You can compare your portfolio against the following benchmarks:

  • DOW JONES INDUSTRIAL AVERAGE

  • EURO STOXX 50 PR

  • FTSE 100 INDEX

  • Global Aggregate

  • Global High Yield

  • MSCI China Index

  • MSCI World

  • Russell 2000 Index

  • S&P 500 Index

  • NASDAQ 100 Stock Index

Interpreting Correlation Values

Explained Here:

Correlation Range

Interpretation

Implication for Portfolio

+70% to +100%

Very strong positive correlation

Portfolio moves almost in tandem with the benchmark. Limited diversification benefits.

+40% to +69%

Moderate positive correlation

Portfolio tends to follow benchmark trends but still allows partial diversification.

+10% to +39%

Weak positive correlation

Portfolio and benchmark share some common drivers but maintain noticeable independence.

0% to +9%

Very weak or no correlation

Portfolio is largely independent of benchmark movements. High diversification benefit.

0% to -9%

Very weak negative correlation

Portfolio has minimal inverse movement relative to benchmark. Slight diversification impact.

-10% to -39%

Weak negative correlation

Portfolio often moves opposite to benchmark. Provides some hedging effect.

-40% to -69%

Moderate negative correlation

Portfolio frequently moves in the opposite direction of benchmark. Strong hedging and diversification.

-70% to -100%

Very strong negative correlation

Portfolio consistently moves opposite to benchmark. Acts as a natural hedge, reducing risk exposure.

Use Case Scenario

You want to see how much your portfolio is influenced by global market trends. By comparing against indices such as the S&P 500 or MSCI World, you can determine:

  • Whether your portfolio is market-driven or more independent.

  • How well your diversification strategy is working.

  • If your portfolio could act as a hedge against specific market indices.

JavaScript errors detected

Please note, these errors can depend on your browser setup.

If this problem persists, please contact our support.