
Fixed Income Monitor
AVAILABLE IN: 

Introduction
The Fixed Income Monitor widget offers a focused view of your portfolio’s exposure to fixed income instruments, helping you analyze allocation, risk and yield characteristics at a glance.
It presents both a table view of key metrics and a breakdown of sector weights, giving you insight into how your fixed income strategy is structured and performing.
What It Shows:
Table View
Provides a summary of fixed income metrics for relevant positions.
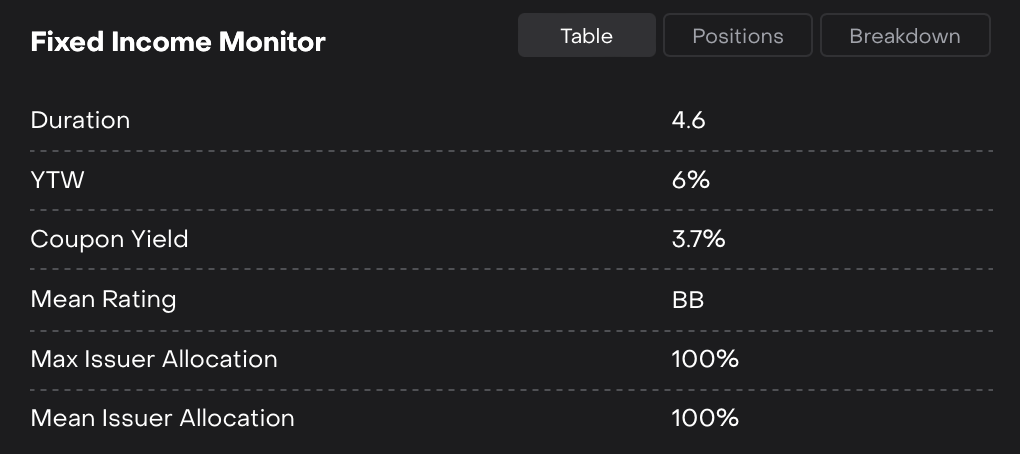
Each metric (except Mean Rating) is shown both including and excluding cash positions, allowing for more flexible interpretation.
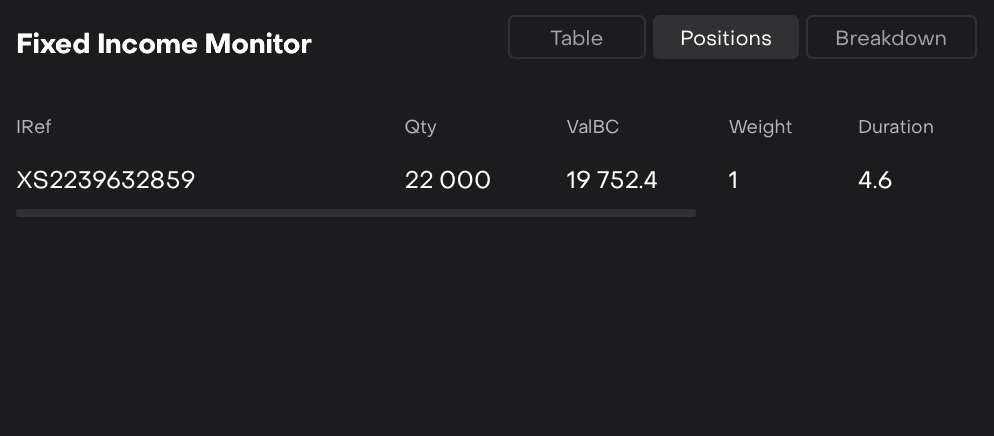
Positions View
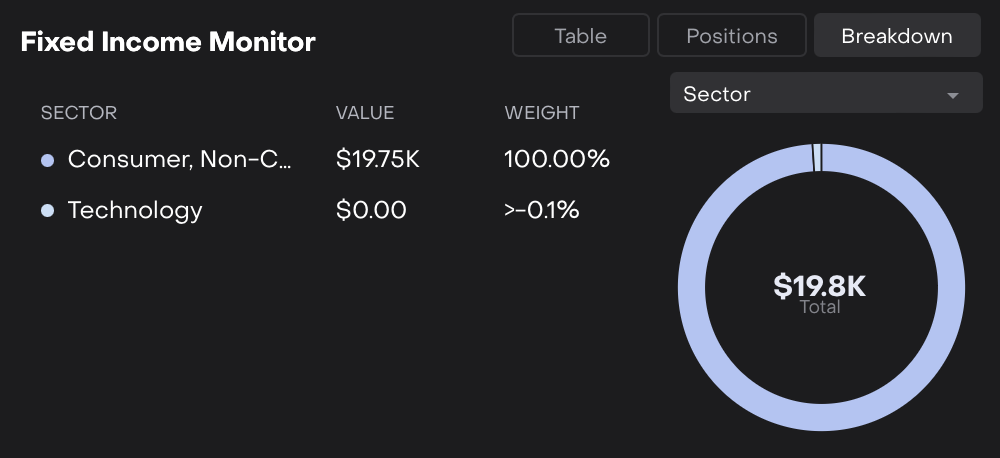
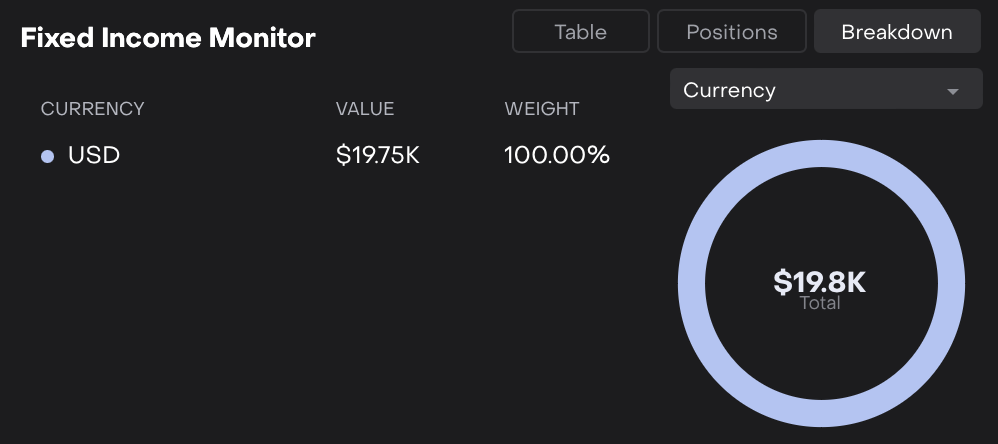
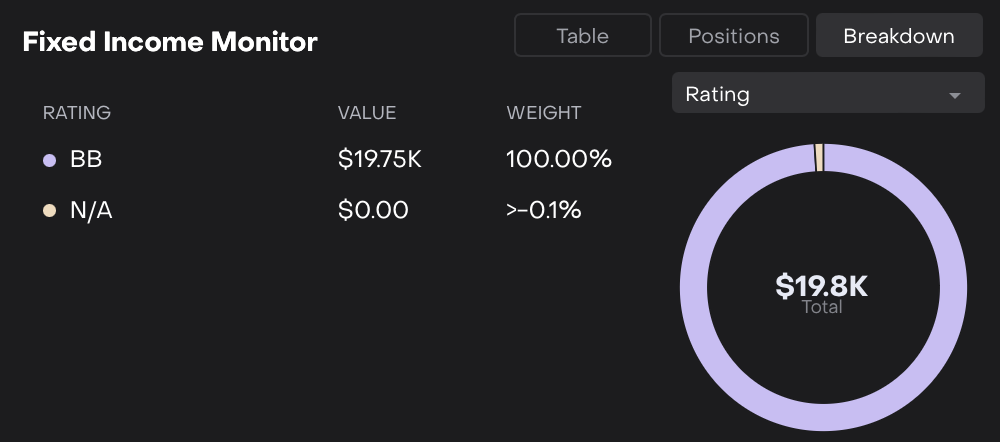
Breakdown View
Visualizes the Weight and Value of each Sector, Currency and Rating in the fixed income strategy.
Common Parameters Paired with Breakdown:
Field/Parameter | Definition |
|---|---|
Value | The total market value (in base currency) of all fixed income positions within it. |
Weight (%) | Percentage of total fixed income allocation that each category represents. |
Sector
Currency
Rating
Fixed Income Breakdown – By Sector
Fixed Income Breakdown – By Currency
Fixed Income Breakdown – By Rating
How It Works:
Pulls data from fixed income positions across your portfolio.
Table values remain constant regardless of the date filter.
Breakdown values change dynamically based on the selected date.
If no fixed income data is available, the widget is automatically hidden.
Values in this section reflect the selected date from the dashboard filters.