Skip table of contents

History Widget

AVAILABLE IN: image-20251027-072316.png image-20251027-072231.png

Introduction

The History widget provides a comprehensive view of your portfolio’s historical risk and performance metrics. It helps you analyze how your portfolio has performed over time and assess its consistency, volatility and overall returns across different time horizons.

How to Use the Widget
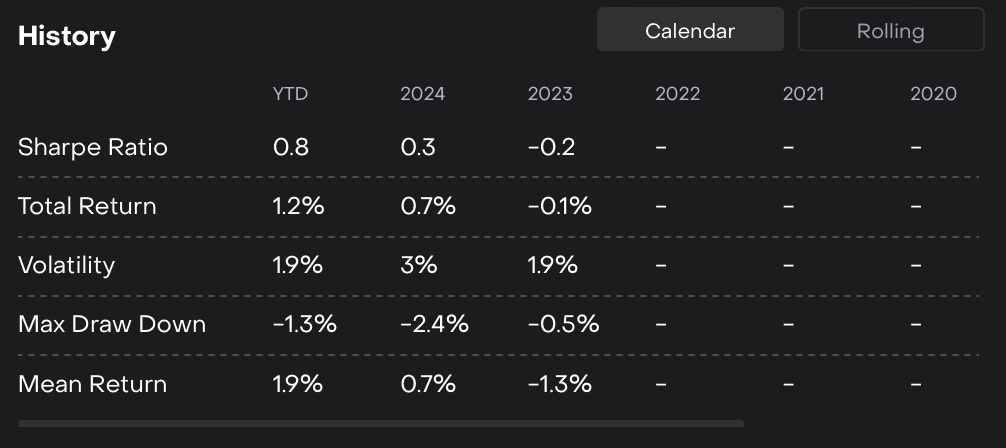
Calendar Periods

You can view performance metrics for fixed calendar-based periods, such as:

  • YTD (Year-to-Date)

  • Previous Calendar Years
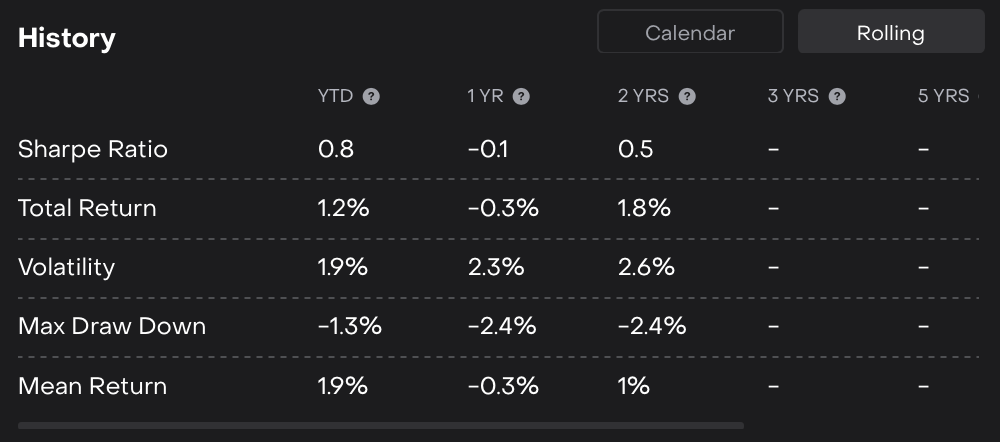
Detailed Widget Parameters Explained:

Parameters

Description

Sharpe Ratio

Measures the risk-adjusted return of the portfolio. A higher value indicates better risk efficiency.

Max Drawdown

The largest observed loss from a portfolio peak to its lowest point before recovery.

Mean Return

The average return achieved over the selected period.

Total Return

The overall cumulative return for the portfolio in the chosen timeframe.

Annual Volatility

Shows how much returns fluctuate annually; higher volatility means greater ups and downs.

Rolling Periods

You can also analyze performance over rolling time horizons, such as:

  • YTD, 1 Year, 2 Years, 3 Years, 5 Years

  • All (full available history)

Calculation Notes

  • Indicators consider positions that were opened mid-period, ensuring accurate reflection of real activity.

  • Results dynamically update based on:

    • Selected Date

    • Currency

    • Bank Account

JavaScript errors detected

Please note, these errors can depend on your browser setup.

If this problem persists, please contact our support.