
Portfolio Performance Chart
AVAILABLE IN: 

Introduction
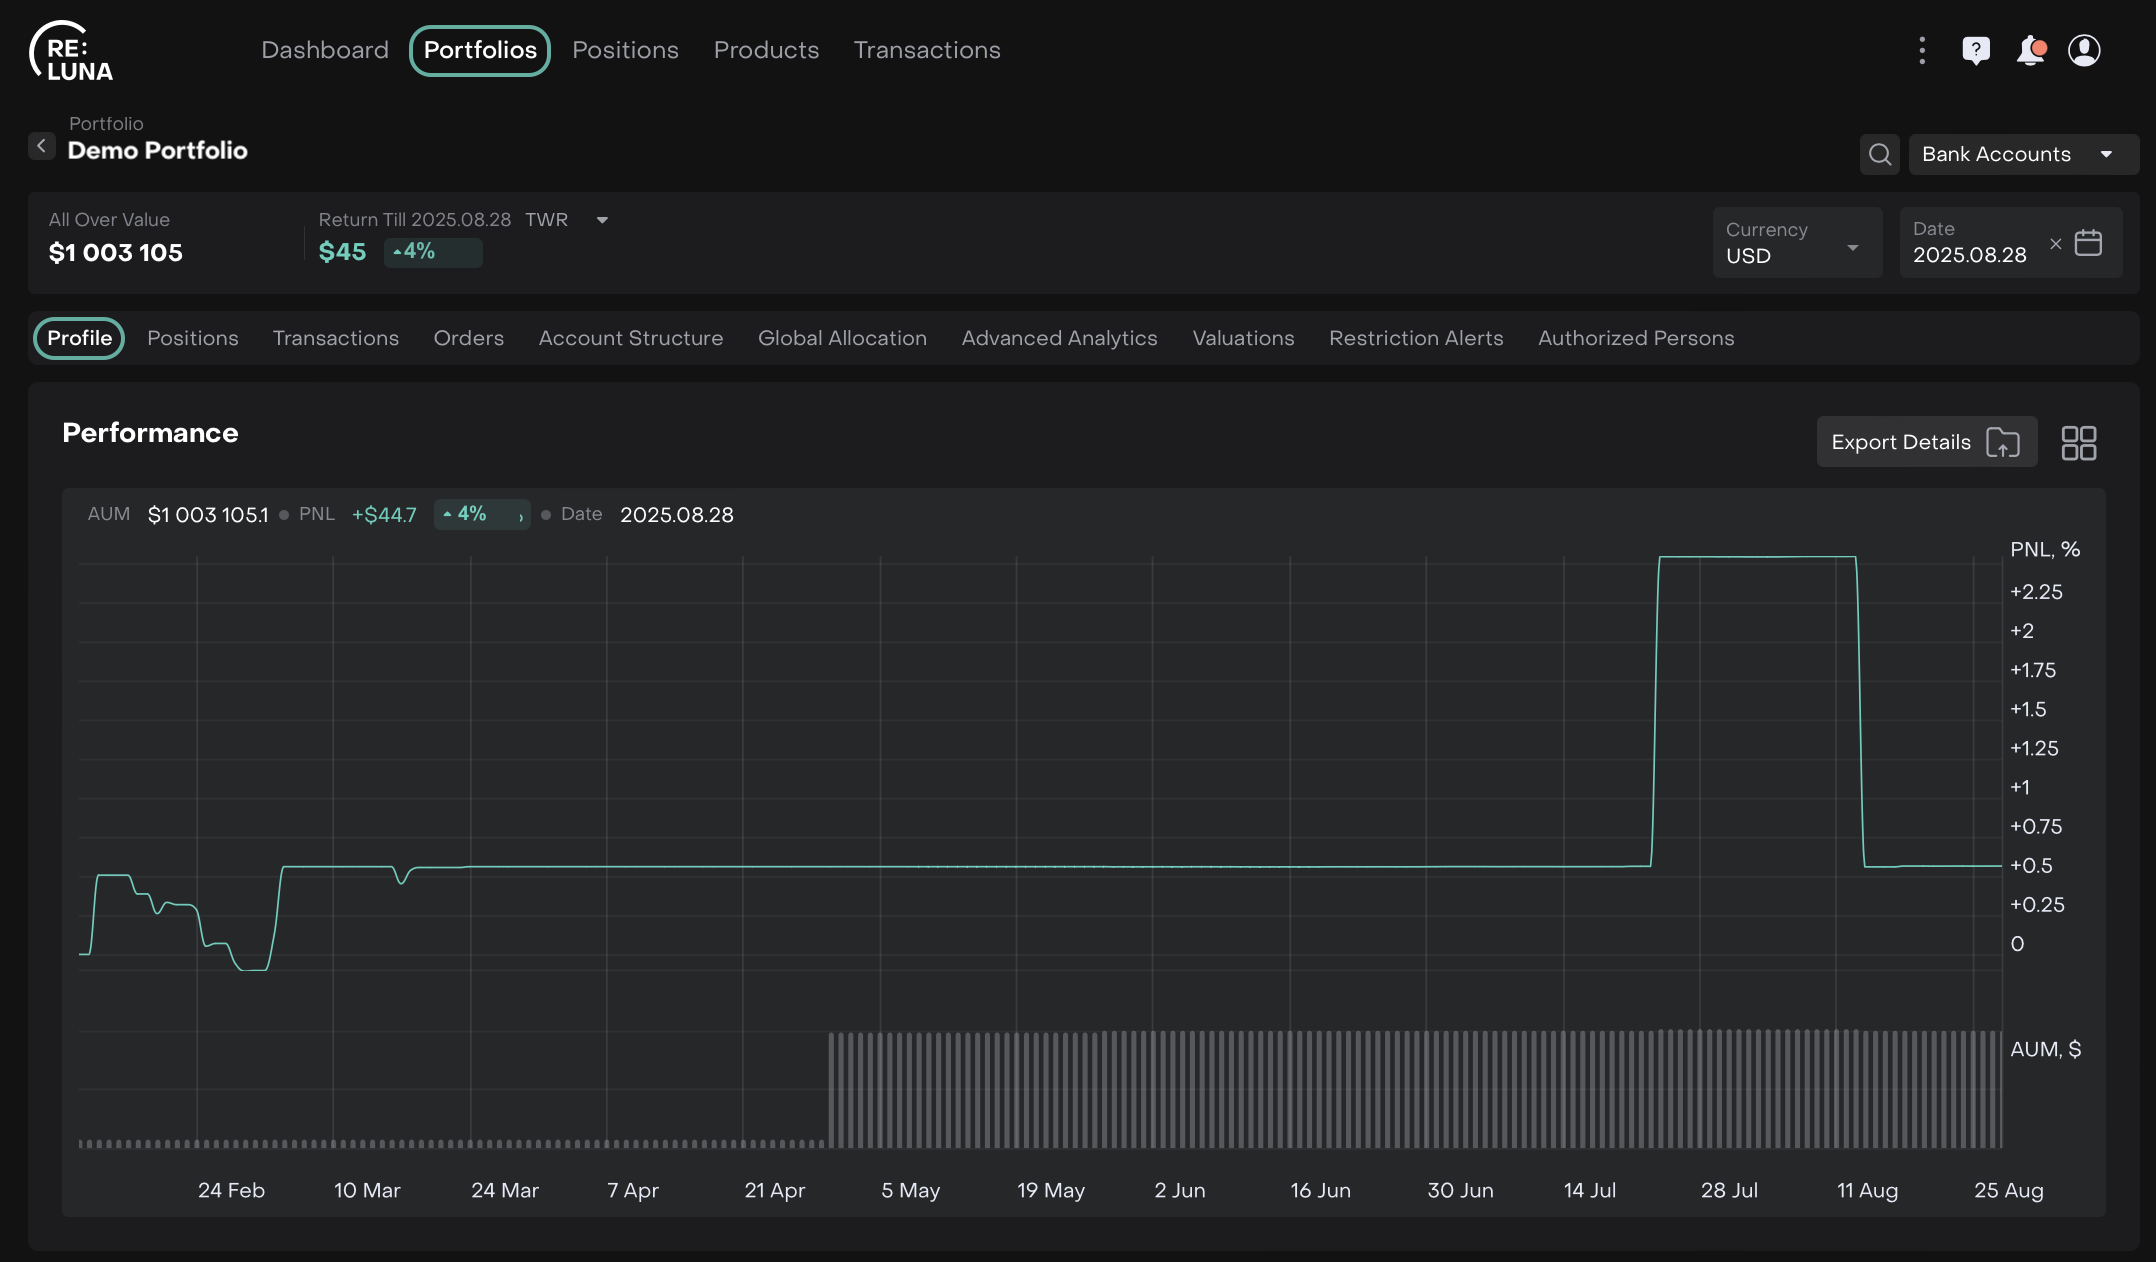
The Portfolio Performance chart helps you track how your portfolio is performing over time. Each column provides specific insights into your portfolio’s value, gains, and losses.
What it Shows:
Visualizes portfolio performance over time, including total AUM and PnL metrics.
Interactions:
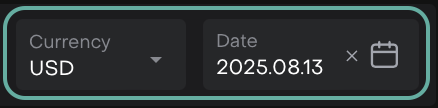
Change Currency/Date to see PnL and AUM for that day.
Change periods to refresh performance data.
Compare your portfolio to indices by selecting from the index list. Tap/hold to view detailed PnL % and cash.
Toggle Index comparison on/off; portfolio metrics remain visible when an index is selected.
Use Total PnL % to see relative performance over time.
Realized vs. unrealized PnL helps differentiate closed vs. open positions.
Exporting Data
Need to analyze or share your data outside the platform? Click the Export Details button to extract table data.
